Question 3 : Describe this visual field and what each letter refers for the letters F-J:
Question 3 : Describe this visual field and what each letter refers for the letters F-J:
F. Pattern deviation: the total deviation, corrected for the overall height of the hill of vision to minimize the effect of media opacity, in dB (top) and the likelihood that the results occurred by chance (bottom).
G. Key to probability symbols.
H. Glaucoma Hemifield Test (see page 51).
I. Global indices. The Visual Field Index (VFI), mean deviation (MD), and Pattern Standard Deviation (PSD) are discussed in the text.
J. Gaze tracker. A gaze deviation is recorded as a line extending upward, while inability to track gaze (e.g. a blink) is recorded as a line extending downward.
Question: Regarding GPA in visual field, describe the results:

Answer:
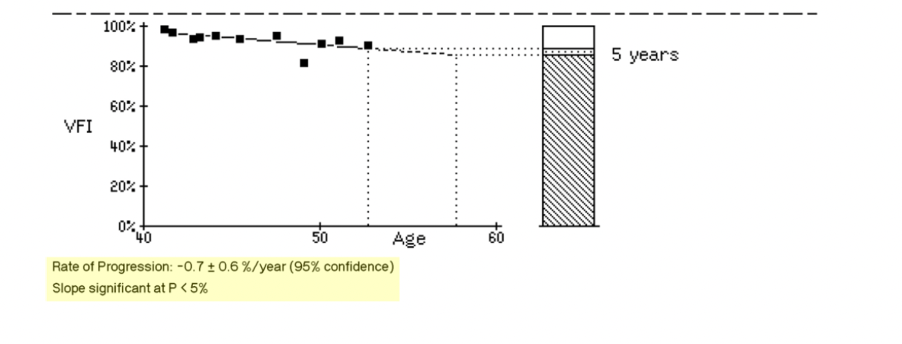
The GPA shows rate of progression in the visual field over time. It displays a rate of progression over time along with confidence intervals. This displays the trend analysis. This regression line determines the rate of change for all of the data collected over time. It is shown as a slope with a percentage rate of change per year.
GPA requires two baseline scans before it can begin to interpret changes over time. It plotting a regression line for the Visual Field Index . The VFI percentage is calculated by the HFA to quantify the patient’s visual function. A slow rate of progression is considered less than 0.5 dB/year, while a very fast rate of progression is considered 1.5 dB/year or higher. However, even slower rates in younger patients are still at risk of progressive field loss due to longer life expectancy with glaucoma.
The slope for the trend analysis also gives a prediction of future progression over the next five years if the patient continues the current treatment plan to slow down progression.
The benefits of trend analysis include:
- Identifying fast progressors
- Identifying generalized, large areas of structural or functional loss
